| |
Benefits of Energy Management |
| |
 |
 |
If you can measure it, you can manage it |
|
Will reduce demand |
|
Will slow need for infrastructure growth |
|
Will save money |
|
Will save environment |
|
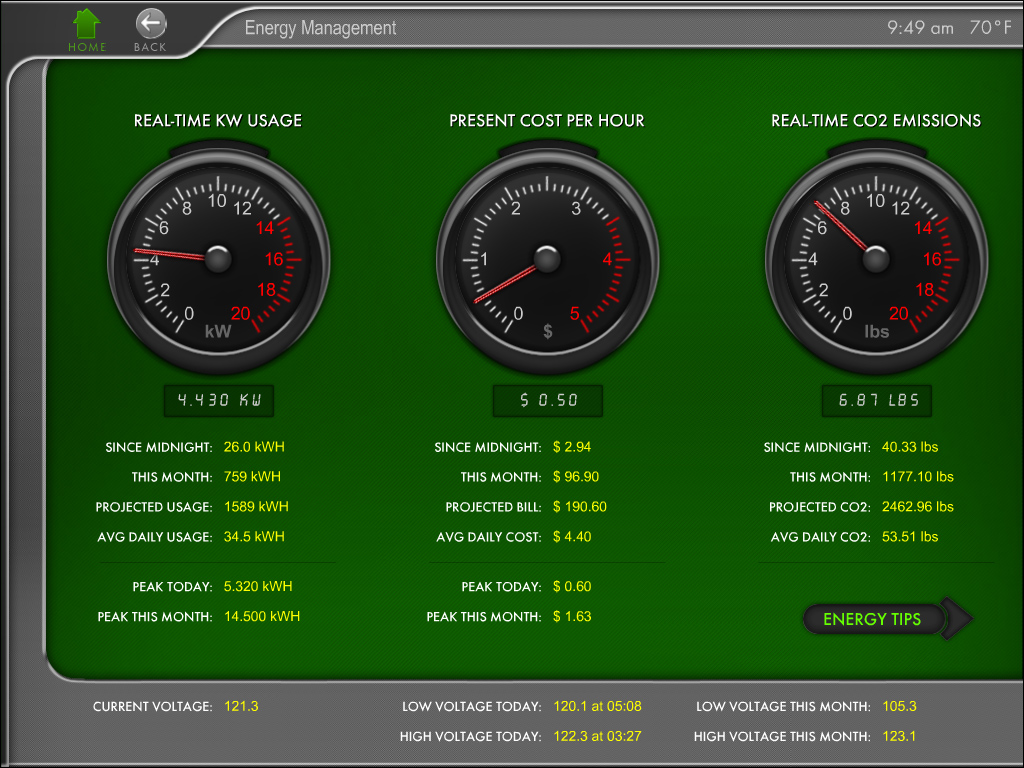
Identifies how much electricity is being consumed that very minute |
|
Tells you how much money is spent each day on electricity |
|
Tells you how much has been spent so far this billing cycle |
|
Tells you what your electricity bill will be |
|
Indicates your daily and monthly peak demand |
|
and much, much more |
| |
|
| |
|
| |
Features |
| |
|
|
Display over 40 up-to-the-second energy use and cost information in an easy-to-read and understand format |
|
View data in kW, Dollar, or in CO2 format |
|
Display data in a variety of predesigned meters and gauges |
|
Historical Data for 13 months can be displayed within the Footprints Application |
|
Supports all meters - Digital, Mechanical, AMR |
|
Accuracy +/- 2% |
|
Supports Most Pricing Rates - 5 Step/Tier Rates, 4 Time-of-Use Rates, Weekend/Holiday Rates, Summer/Winter Rates, Taxes, Energy/Fuel Surcharges, Minimum Charges, Fixed Charges or any combination of the above |
| |
|
| |
|
| |
Software
Requirements |
| |
|
|
MainLobby
3 |
|
MLServer
3 |
|
MLEnergyManagement Family
Plugin |
|
TED Software Driver (Includes Support for all TED 1000/1002/5000 Models) |
|
TED
Footprints Software (Only Required for TED 1001/1002) |
| |
|
| |
|
| |
Hardware
Requirements |
| |
|
|
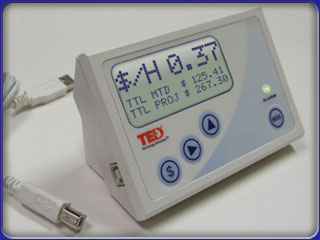
TED
1001/1002 Power Monitoring
Hardware (Requires USB connection) |
|
TED 5000 Series |
| |
|
| |
|
| |
Supported Commands |
| |
|
|
Set the date update rate (per second) |
| |
|
| |
|
| |
Description of Exposed MLServer Variables |
| |
|
|
The current spending rate. |
|
Total cost of energy used today (includes taxes). |
|
Total cost of energy Month to Date (includes fixed costs,
minimums & taxes). |
|
Total projected bill at the end of the current billing cycle. |
|
Average daily spending for the current billing cycle. |
|
The current energy usage. |
|
Total energy used today. |
|
Total energy used Month to Date. |
|
Total projected energy usage at the end of the current
billing cycle. |
|
Average daily energy usage for the current billing cycle. |
|
The current CO2 production. |
|
Total CO2 production today. |
|
Total CO2 production Month to Date. |
|
Total projected CO2 production the end of the current
billing cycle. |
|
The average daily CO2 production for the current billing
cycle. |
|
The current voltage being supplied. |
|
Current Status of the LED light. Values are GREEN,
RED, YELLOW |
|
Current Buzzer Status. Values are ON, OFF |
|
Total number of days left in the current billing cycle |
|
The energy current rate being charged by the power
company. |
|
The lowest voltage recorded today. |
|
The time of the lowest voltage recording today (e.g.
13:30 = 1:30pm) |
|
The highest voltage recorded today. |
|
The time of the highest voltage recording today (e.g.
13:30 = 1:30pm) |
|
The lowest voltage recorded Month-to-Date. |
|
Day of the Month when the lowest voltage was
recorded. |
|
The Highest voltage recorded Month-to-Date. |
|
Day of the Month when the highest voltage was
recorded. |
|
The peak/highest energy usage today (in kW). |
|
The peak/highest spending rate today. |
|
The peak/highest energy usage Month-To-Date. |
|
The peak/highest spending rate Month-To-Date. |
|
Total used today. |
| |
|
| |
|
| |
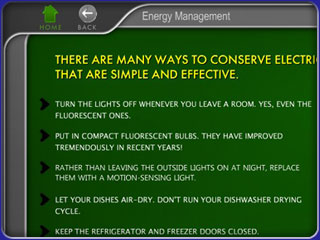
Sample Tips Screen to Educate Home Owners |
| |
 |
| |
|